Platform Dashboard
A real-time command center giving platform administrators an instant overview of the entire system — services, companies, revenue, email, chats, and login activity — all in one place.
Key Features
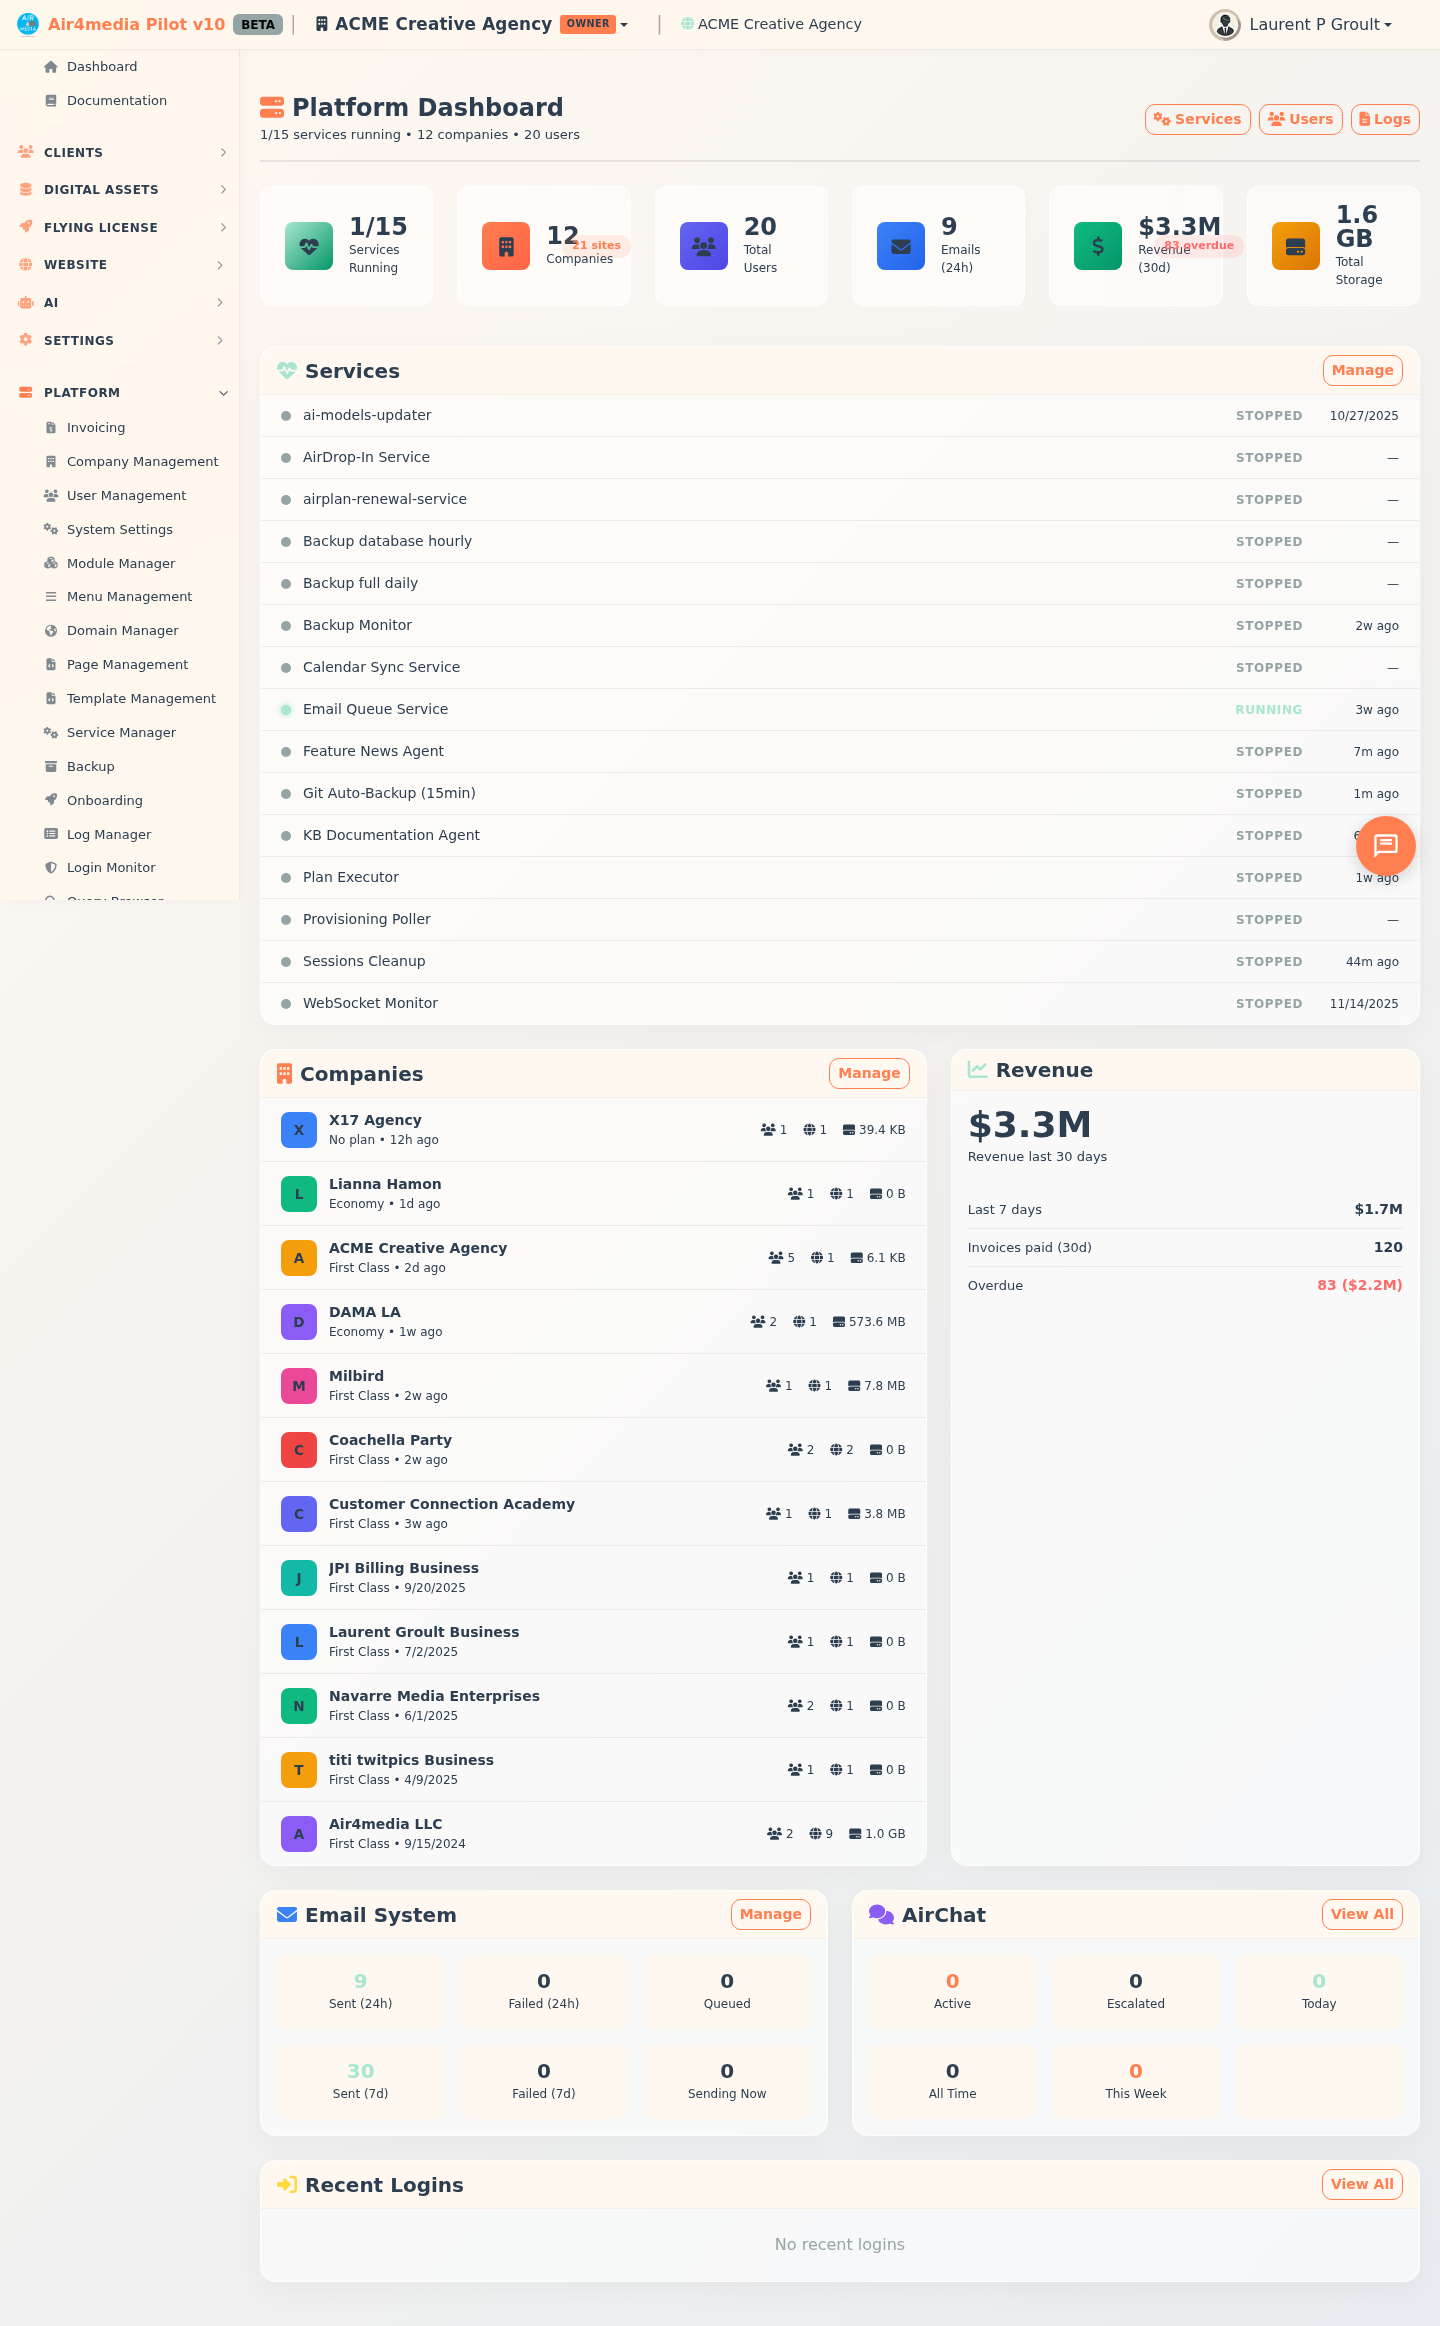
- Live Status Line: Just below the page title, a one-line summary shows the current state at a glance — for example, "12/12 services running • 8 companies • 24 users" — turning red if any service has errors.
- Health Indicator Cards: Six at-a-glance cards showing services running, total companies (with site count), total users, emails sent in the last 24 hours, revenue for the last 30 days, and total storage used across all companies. Alert badges appear directly on the cards when there are service errors, failed emails, or overdue invoices.
- Services Status: A live list of every background service with its current status (running, stopped, or error) and how long ago it last ran. A color-coded dot makes it easy to spot problems at a glance.
- Companies Overview: A scrollable list of all companies on the platform — for example, ACME Creative Agency appears here with its subscription plan, user count, site count, and storage usage. Sorted by most recently created.
- Revenue Panel: A summary of paid invoice revenue for the last 30 days and last 7 days, the number of invoices paid, and any overdue invoices with their total outstanding amount.
- Email System: Delivery statistics for outgoing emails — sent and failed counts for the last 24 hours and 7 days, plus how many are currently queued or actively sending right now.
- AirChat: A snapshot of customer chat conversations — active sessions, escalated chats, new conversations today, and totals for the week and all time.
- Recent Logins: The 10 most recent login attempts across all users, showing name, IP address, time, and whether the login succeeded or failed.
How to Use
- Open the Platform Dashboard from the main navigation.
- Check the live status line and the six health cards at the top — red indicators signal issues that need attention.
- Scroll down to the Services list. Any service showing "error" should be investigated — click Manage on the Services panel or Services in the top-right toolbar.
- Review the Companies panel to see new sign-ups or check storage and site usage per account.
- Monitor the Revenue panel for overdue invoices that may need follow-up.
- Use the Email System panel to confirm messages are being delivered — a high failed count may indicate a configuration issue.
- Watch the Recent Logins list for any failed attempts that could signal unauthorized access.
Tips
- Click Services, Users, or Logs in the top-right toolbar to jump directly to the relevant management page.
- The Companies and Email System panels each have a Manage link for quick access to deeper controls.
- Click View All in the AirChat or Recent Logins panel to open the full history view.
- Data loads automatically when you open the page — refresh to get the latest numbers.
- Overdue invoice counts shown in red on both the health cards and the revenue panel represent the same data — address them from the invoicing section.