Login Monitor
Track every login attempt across the platform in real time. See who is logging in, when, from which IP address, and whether they succeeded or failed. This page is only available to platform administrators.
Key Features
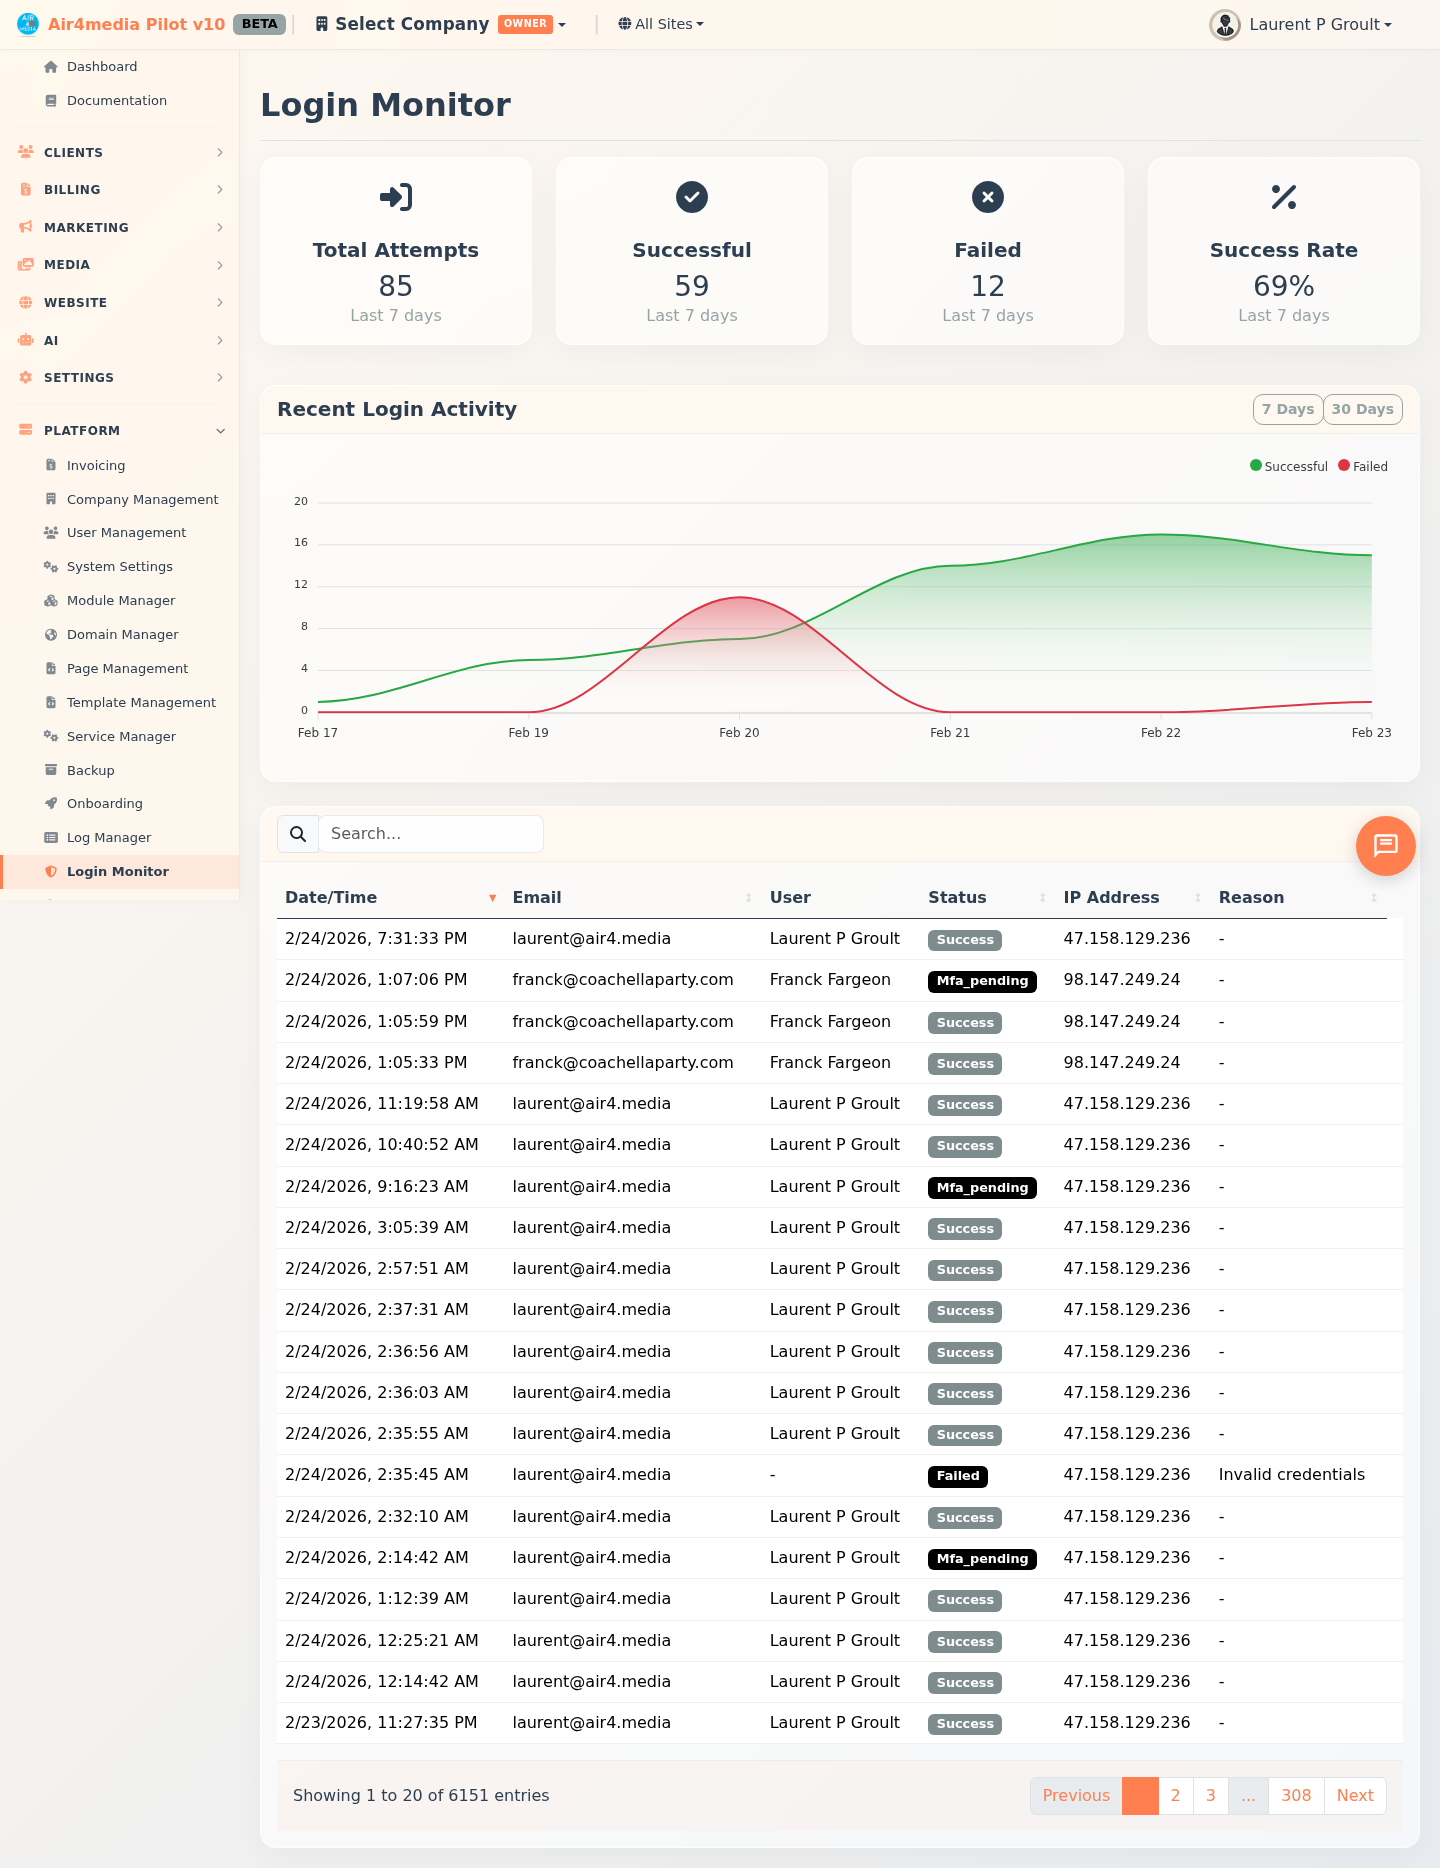
- Summary Stats: Four cards at the top showing Total Attempts, Successful logins, Failed logins, and Success Rate — all calculated over the past 7 days.
- Activity Chart: A smooth area chart showing successful vs. failed logins over time, with green and red shading so trends are easy to spot at a glance.
- 7-Day / 30-Day Toggle: Switch the chart between a 7-day and 30-day view to see recent activity or longer-term patterns.
- Login Attempts Table: A full, paginated log of every login attempt — showing Date/Time, Email, User name, Status, IP Address, and failure Reason.
- Sortable Columns: Click any column header to sort by date, email, status, IP address, or failure reason.
- Search: Filter the table by email address, IP address, or user name to quickly locate specific activity.
How to Use
- Open Login Monitor from the sidebar.
- Check the four stat cards at the top for a quick 7-day summary — Total Attempts, Successful, Failed, and Success Rate.
- Review the Recent Login Activity chart to see trends. Click 7 Days or 30 Days to change the time window.
- Scroll down to the Login Attempts table for the full record-by-record log.
- Click any column header to sort the list. Use the search box to filter by email, IP address, or user name — for example, search
acme-creative.air4.mediato see all login activity from the ACME Creative Agency account. - Check the Status badge — a green Success badge means the login went through; a red Failed badge means it was rejected.
- For failed attempts, read the Reason column to see why access was denied (e.g. wrong password, account not found).
Tips
- The Success Rate card is color-coded: green means above 80% (healthy), yellow means 60–80% (worth watching), and red means below 60% — which may indicate a brute-force attack or widespread credential issues. Investigate promptly if you see red.
- Sort by IP Address to spot a single source generating repeated failed attempts.
- Switch to the 30-day chart to identify recurring patterns, such as spikes at specific times of day or week.
- The table is read-only — use it for monitoring and investigation, not account management.