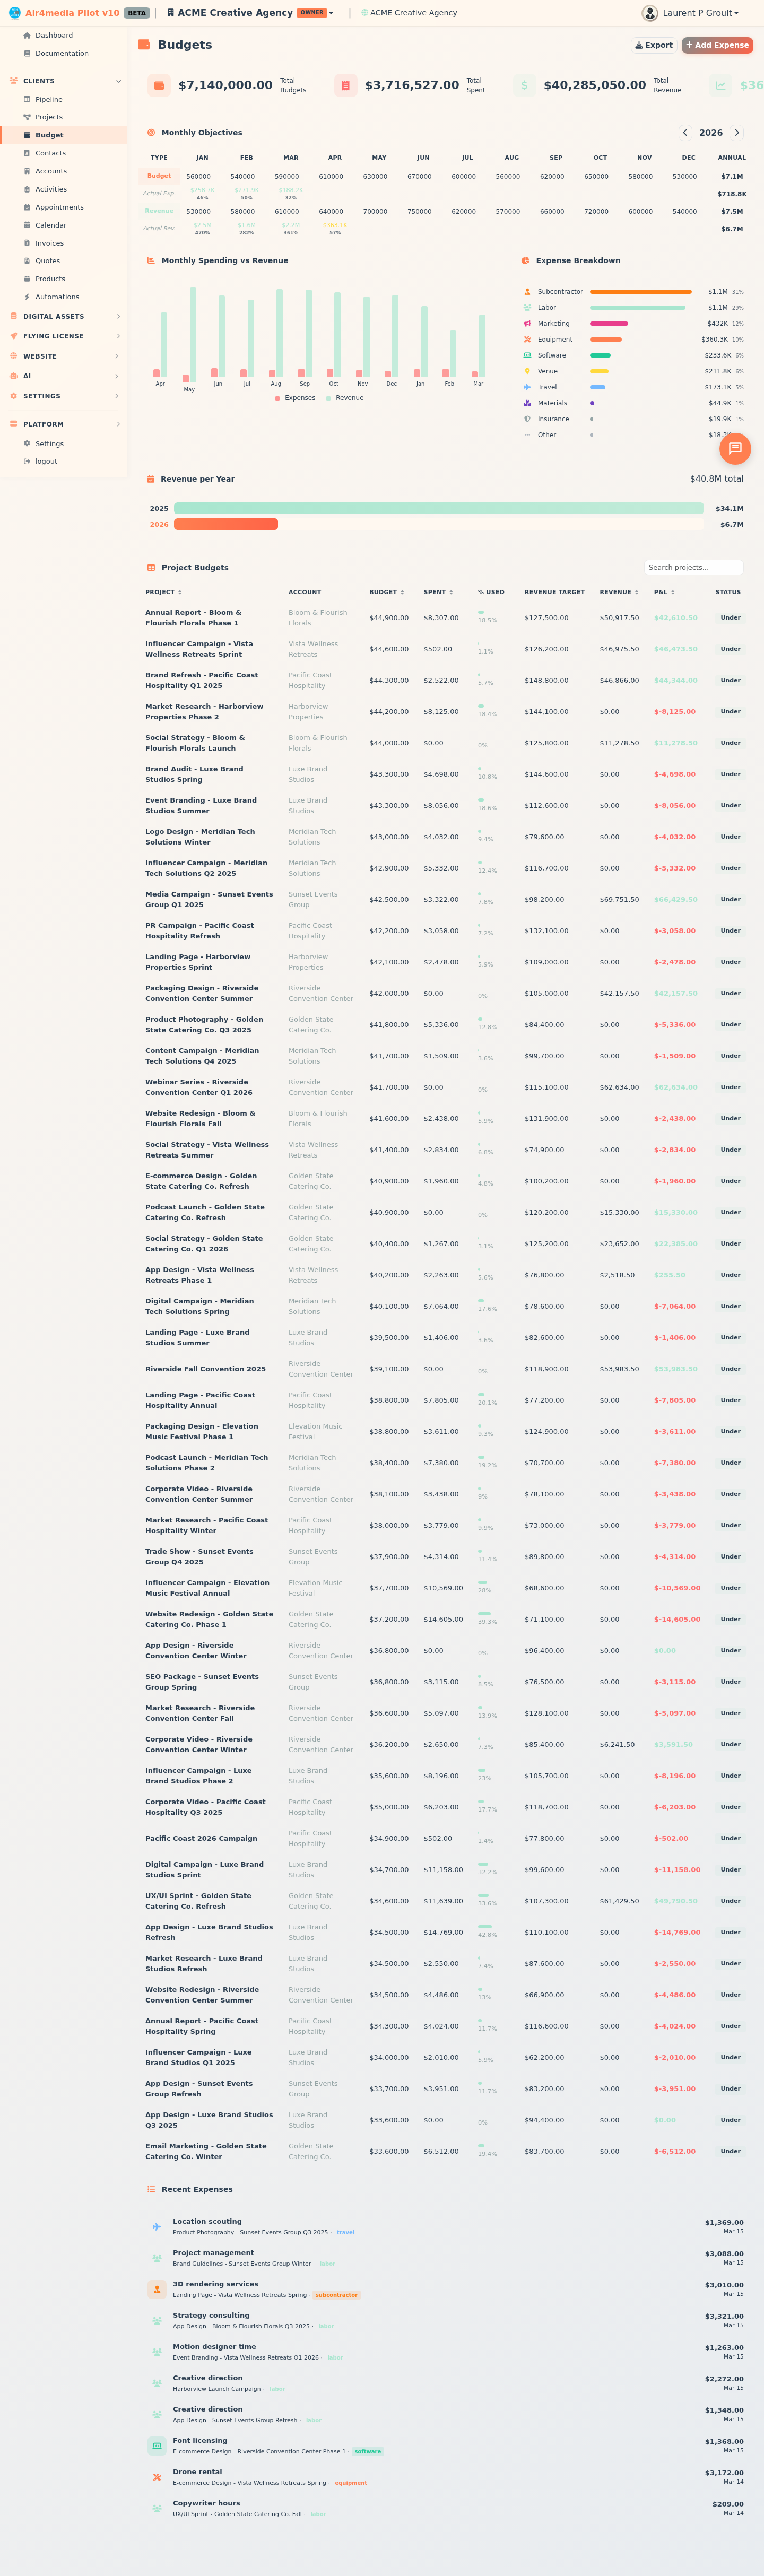
Budget
The Budget page gives ACME Creative Agency a complete financial picture across all projects — tracking what you've spent, what you've earned, and how you're tracking against your goals.
Key Features
-
KPI Summary: Four headline numbers at the top — Total Budgets, Total Spent, Total Revenue, and Overall P&L. The P&L turns green when you're profitable and red when you're not.
-
Monthly Objectives Grid: Set your budget and revenue targets month by month for the year. Just click any number and type a new value — it saves automatically. Rows show your targets alongside actual expenses and actual revenue so you can see how each month compares. Use the arrows to flip between years.
-
Monthly Spending vs Revenue Chart: A side-by-side bar chart covering the last 12 months. Red bars are expenses, green bars are revenue — a quick way to spot which months were your strongest.
-
Expense Breakdown: See where your money is going by category — Labor, Equipment, Subcontractor, Travel, Software, and more. Each category shows its share of total spending as a percentage bar.
-
Revenue per Year: A horizontal bar chart showing total paid revenue for each year ACME has been active. The current year is highlighted.
-
Project Budgets Table: Every active project listed with its annual budget, total spent, a % used progress bar, revenue target, revenue earned, P&L, and a status badge (Under / On Target / Over). Click any column header to sort. Click any row to open that project.
-
Recent Expenses: The 10 most recent expense entries across all of ACME's projects, with category, project name, amount, and date.
-
Add Expense: Log a new expense directly from this page without going into a specific project.
-
Export: Download the full project budgets table as a CSV file for reporting or accounting.
How to Use
- Open the Budget page from the sidebar to see your financial overview load automatically.
- Review the four KPI cards at the top for a quick health check.
- In the Monthly Objectives section, enter your spending budget and revenue targets for each month — type directly into any cell and it saves within a couple of seconds.
- Scroll down to the Project Budgets table to see how individual projects are performing. Use the search box to find a specific project quickly.
- Click Add Expense (top right) to log a cost — select the project, enter a description, amount, date, and category. Check "Billable to client" if the cost can be passed on.
- Click Export to download the project budgets as a spreadsheet.
Tips
- A project's status badge turns red (Over) when spending exceeds its budget by more than 10% — a quick warning sign to investigate.
- The Monthly Objectives grid auto-saves as you type, but you'll see the row turn yellow briefly to confirm it's been registered.
- Clicking a project row in the table takes you directly to that project's detail page.
- Categories in the Expense Breakdown are set when you log each expense — being consistent with categories (e.g., always using "Labor" for staff costs) makes the breakdown more useful over time.